Catching Anomalies Early in Mobile App Releases

Operationalized, App Release Anomaly Detection has helped us prevent nearly all severe critical client-side regressions and gives us peace of mind to release bigger changes at a more rapid cadence.
Author: Walt Leung
A copy of this study was also shared on the Nextdoor Engineering Blog, which you can see here.
Introduction
At Nextdoor, our mobile applications on iOS and Android serve content to tens of millions of weekly active users. At this scale, we run a weekly release process for both iOS and Android, shipping hundreds of changes across multiple teams and dozens of mobile engineers.
Our team uses several observability processes and rollout strategies to keep these deployments safe and scalable. We most notably use phased rollouts to minimize the impact of a potentially bad release. Phased rollouts allow us to gradually increase the adoption of users for a new app version. For example, we can have a new app version be released to only 1% of users on the 1st day, 2% of users on the 2nd day, and so on. That way, if a new release were accidentally shipped with an uncaught regression, having it at 1% rollout means it affects fewer users, reduces its severity level, and gives us more time to react.
However, for many of our critical business metrics where a failure can sometimes be silent, most out-of-the-box observability approaches don’t work with phased rollouts. This is largely due to two problems:
- Observability typically happens at an aggregate level. For example, we look at app sessions or revenue on a daily basis, across all users for a platform.
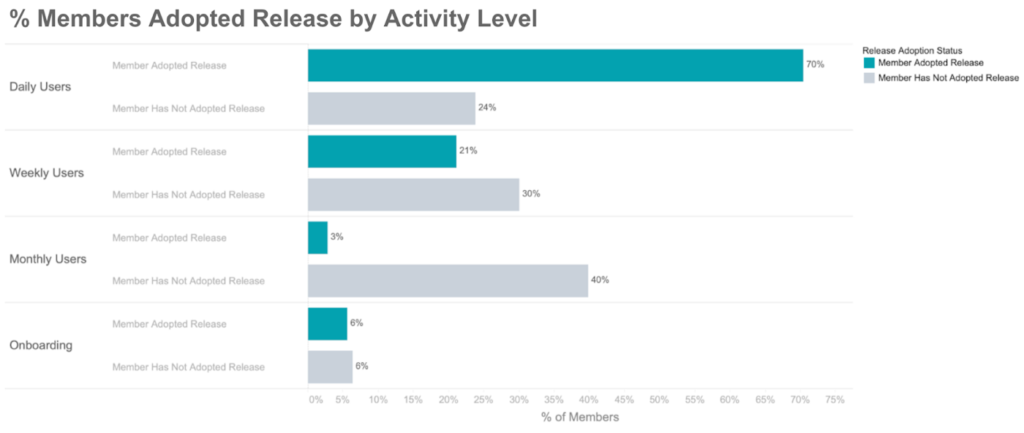
- The behavior of early adopters on an app version differs from the median behavior of all users. Most importantly, early adopters are more active, almost by definition, to be in an early rollout of the new app version.
For example, consider an app session regression on a hypothetical iOS version v1.234.5 released March 4. If we had unknowingly introduced a regression where we didn’t count an app session 5% of the time, at a 1% rollout, our aggregate impact would be expected to be roughly 0.05 x 0.01 = 0.05% of all iOS app sessions, which is practically impossible to detect (read: noise) with aggregate-level observability. Even worse, early app adopters skew more active, which means that maybe we should expect 0.06% of all sessions impacted. Or maybe 0.07% of all sessions impacted. In short, it’s hard to tell exactly what our aggregate impact should be.
However, when iOS release v1.234.5 reaches full rollout in a week, a 5% app session regression would be business critical. We can detect the app sessions drop once it reaches full rollout by looking at week-over-week or month-over-month metrics, but by that point, several days would have passed.
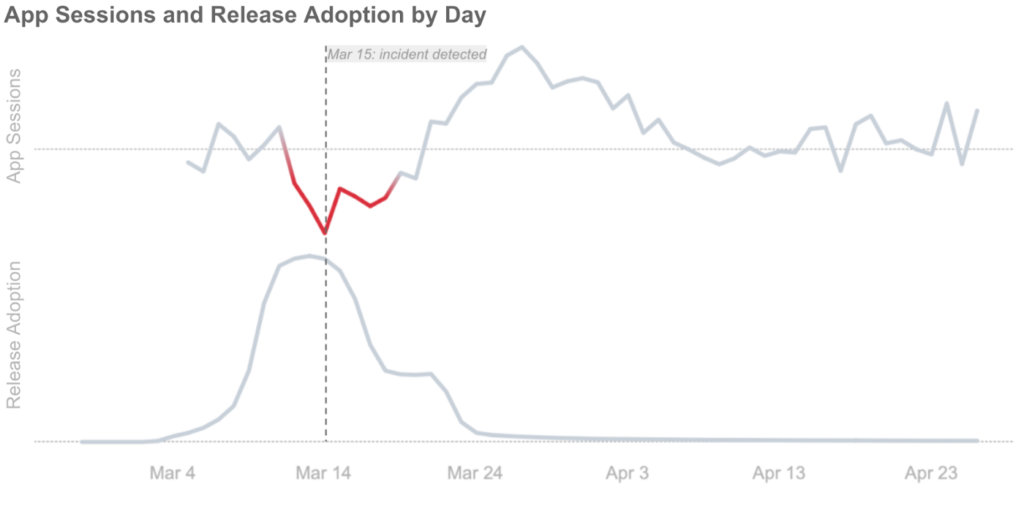
How can we detect these issues on day 1, at 1% rollout?
A simple approach would be to normalize our business metrics to the total number of users on the release, and turn all metrics into relative metrics (e.g. on v1.234.5, app sessions per active user per app version). Unfortunately, as mentioned earlier, we can’t directly compare the app sessions from users who have adopted a release to those who haven’t as their underlying characteristics are too different.
What we’re trying to solve for these early adopters is: what is the difference between their actual app sessions after adoption compared with their hypothetical app sessions had they never adopted the release in the first place, or an unobserved counterfactual? In statistics, we can measure this through difference-in-differences analysis.
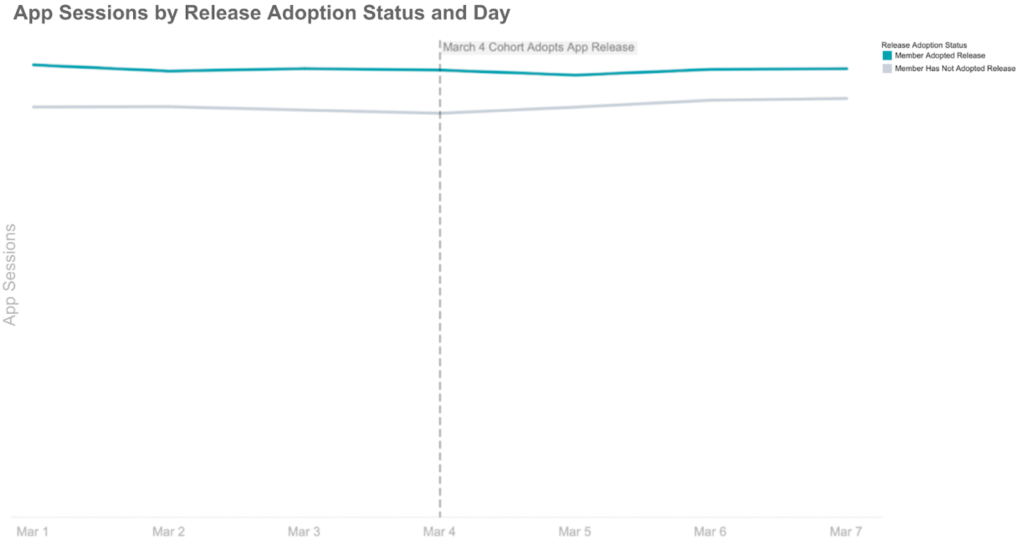
Difference-in-differences analysis is a simple causal inference method we can apply here to estimate this effect by accounting for the separate time varying effects of users that have and have not adopted a release:
- For users who adopted the release, calculate the difference in their app sessions three days before and three days after the release period. In this case, we observed a -0.02 decline in app sessions.
- Do the same for users that have not adopted the release. In this case, a +0.20 increase in app sessions.
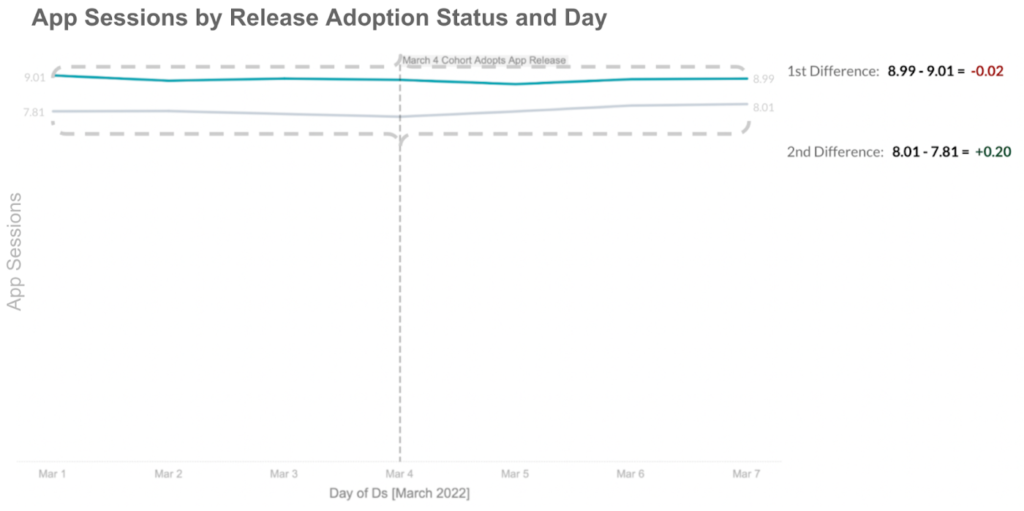
Assuming trends would have otherwise remained constant (pre-trend assumption), we would have expected app sessions of release adopters to increase by +0.20 like we observed with non-adopters. However, they instead decreased by -0.02. We calculate the difference in differences to estimate a comparison against an unobserved counterfactual:
-0.02-0.20 = -0.22 decrease in app sessions due to iOS release v1.234.5
In practice, we don’t just calculate this in aggregate. We first make sure that our two cohorts exhibit similar behavior pre-adoption (pre-trend assumption). This is a critical step to difference-in-differences analysis. With a sample size over hundreds of thousands of users, we can achieve high confidence in similar pre-trend behavior with a simple standard deviation bound over the preceding few days to adoption. If this behavior holds, we then fit a linear regression model that estimates the average effect of a release for any particular metric:
y = β0 + β1* Time_Period + β2* Treated + β3*(Time_Period*Treated) + e
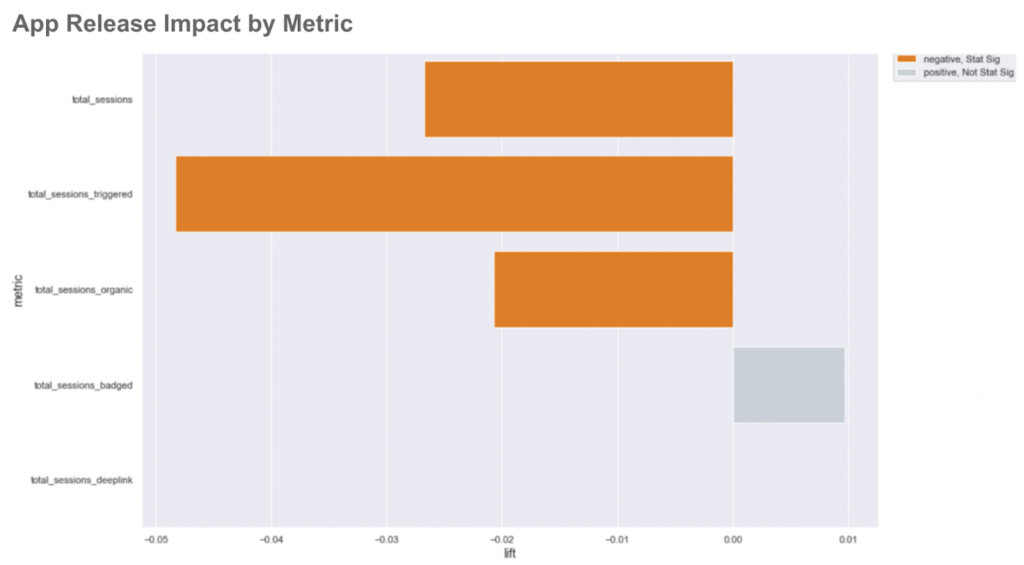
In the case of v1.234.5, we can measure statistically significant negative effects across multiple app sessions metrics.
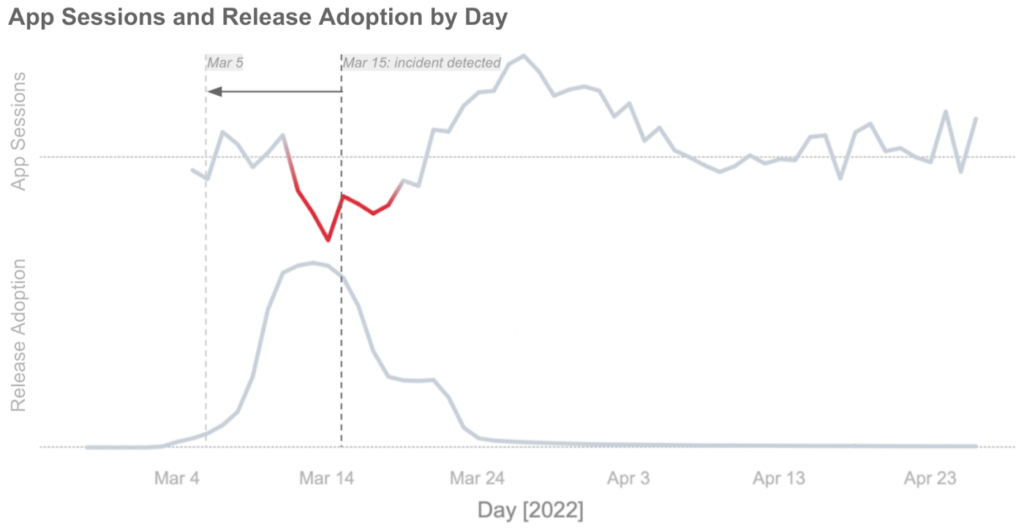
With this difference-in-differences approach, we are now able to flag the app sessions decline due to v1.234.5 on March 5th, 10 days earlier than we normally would have been able to using week over week figures. We also mitigate the need to factor in external variables such as seasonality or day of week. This not only helps in diagnosing the source of the decline to a specific app release, it also isolates the regression to less than 1% of iOS users.
App Release Anomaly Detection is one of the many tools we’ve built at Nextdoor to give us observability into our releases while iterating quickly. It is one of the foundational elements that allows us to deploy major app releases on a weekly cadence and have confidence in our stability. Operationalized, App Release Anomaly Detection has helped us prevent nearly all severe critical client-side regressions and gives us peace of mind to release bigger changes at a more rapid cadence.
If this type of cross-functional work between platform engineering and data science at scale interests you, we’re hiring! Check out our Careers page for open opportunities across all our teams and functions.
Written by Walt Leung and Shane Butler, with support from Hai Guan, Charissa Rentier, Qi He, and Jonathan Perlow.